Cross-curricular unit plan · Grade 4 · 4 weeks
A Grade 4 Cross-Curricular STEM Unit Plan: Math, Geography, and the Solar System in Four Weeks
A complete classroom- and homeschool-ready unit plan that braids four content areas into a single coherent four-week experience. Students leave the unit fluent in fraction comparison, comfortable reading real government data, able to locate all fifty US states on a map, and oriented in the structure of our solar system — using the same evidence-based tools the rest of the science world uses. NGSS + Common Core aligned, with daily activities, assessments, and differentiation guidance.
1. At-a-glance
- Grade level
- Grade 4 (also useful for advanced Grade 3 or struggling Grade 5)
- Duration
- 4 weeks · 5 sessions/week · 30–45 minutes per session
- Audience
- Classroom teachers and homeschool parents
- Subjects integrated
- Math, US geography, Earth/space science, writing
- Primary GeoProwl sections used
- Figure It Out, GeoZone, Solar System
- Culminating project
- One-page “State Snapshot Report” using site data
2. Standards alignment
Every activity in this unit is anchored in a published standard. Where multiple standards apply we list the most central one. The unit doubles as state-test prep for the NAEP Grade 4 math and reading frameworks because the underlying skills overlap heavily with NAEP's “use evidence from the text” and “solve multi-step problems” categories.
| Code | Description | Unit connection |
|---|---|---|
CCSS.4.NF.A.1 | Recognize and generate equivalent fractions; explain why a fraction a/b is equivalent to a fraction (n × a)/(n × b). | Fraction Face-Off Easy and Medium tiers. |
CCSS.4.NF.A.2 | Compare two fractions with different numerators and different denominators. | Fraction Face-Off Medium and Hard tiers; cross-applied in Ratio Kitchen. |
CCSS.4.NF.B.3 | Add and subtract fractions and mixed numbers with like denominators. | Fraction Face-Off Medium tier; informal in Ratio Kitchen recipe scaling. |
CCSS.4.MD.A.1 | Know relative sizes of measurement units within a system. | Solar System Scale Detective uses real distance and mass comparisons. |
CCSS.4.MD.B.4 | Make a line plot to display a data set of measurements in fractions of a unit. | Data Detective uses real Census and USDA datasets for plotting. |
CCSS.4.OA.A.3 | Solve multistep word problems with whole numbers using the four operations. | Data Detective and State Showdown comparison problems. |
CCSS.W.4.7 | Conduct short research projects that build knowledge through investigation of different aspects of a topic. | Culminating State Snapshot Report project. |
NGSS 5-ESS1-1 | Support an argument that differences in the apparent brightness of the sun compared to other stars is due to their relative distances from Earth. | Planet ID and Scale Detective introduce the concept of astronomical distance — bridges Grade 4 to Grade 5 science. |
C3.D2.Geo.2.3-5 | Use maps, satellite images, photographs, and other representations to explain relationships between the locations of places and regions. | Just States, Just Capitals, and the Recon Photos game. |
3. Unit structure and daily activities
The unit follows a deliberate sequence: math first (because fluency unlocks the data work later), then geography (because the state data feeds into math problems), then solar system (because the scale work depends on confident multi-digit number sense), then a synthesis project that draws on all three. Each session is structured the same way: a 5-minute warmup, 20–30 minutes of core activity, 5–10 minutes of reflection or exit ticket. Reflection time is non-negotiable — it's where the cross-curricular connections get made explicit.
Week 1 — Fraction fluency
Goal: every student can compare any two fractions with unlike denominators by the end of the week. This is the load-bearing skill for everything that follows.
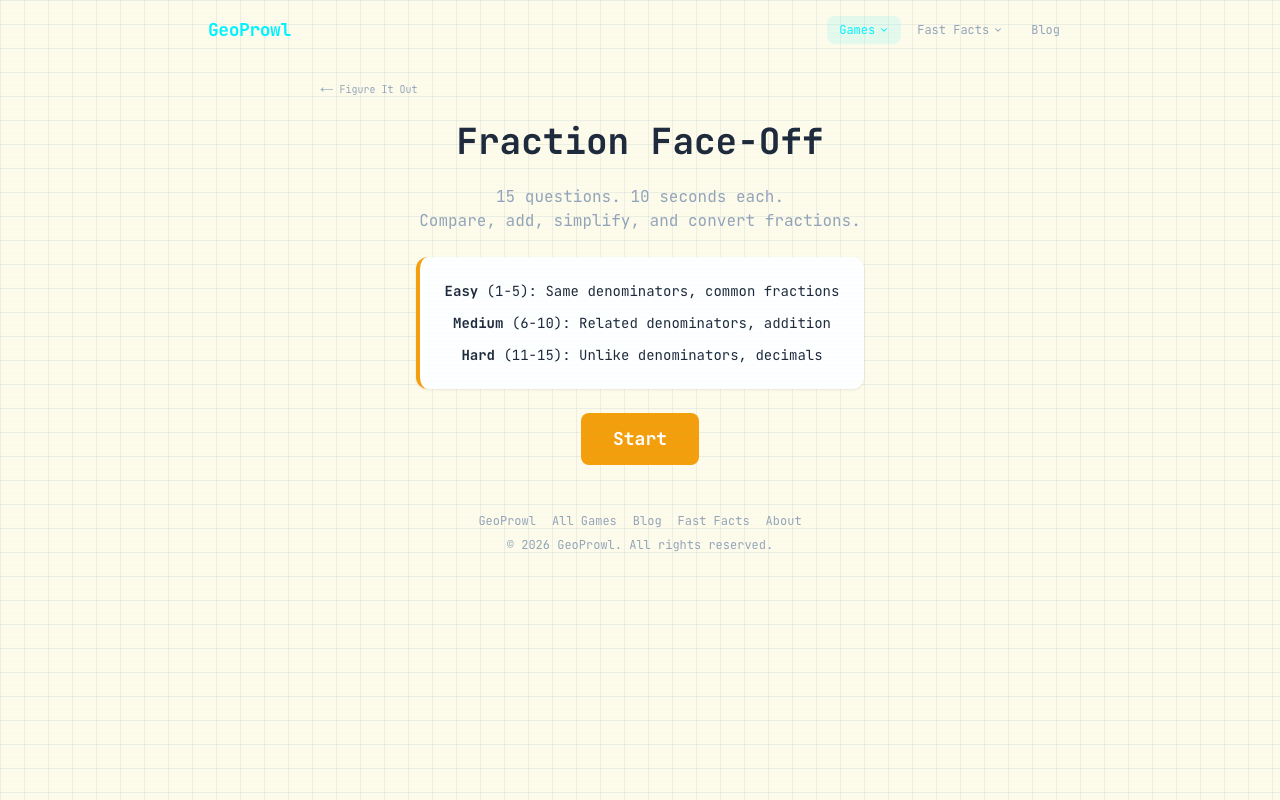
- Day 1 — Diagnostic. Have every student play one Easy round of Fraction Face-Off. Record scores privately. This is your starting line, not a grade. Then teach a 10-minute mini-lesson on what equivalent fractions mean using a fraction-bar model on the board.
- Day 2 — Equivalents. Students play three Easy rounds of Fraction Face-Off. Track which two fractions trip them up. Exit ticket: write one equivalent fraction for 2/3 (answer: 4/6, 6/9, etc).
- Day 3 — Comparing unlike denominators. Mini-lesson: how to find a common denominator using a multiplication table chart. Students play three Medium rounds of Fraction Face-Off. Exit ticket: which is bigger, 3/4 or 5/7? Show your work.
- Day 4 — Adding fractions. Switch to Ratio Kitchen for hands-on scaling — “the cookie recipe makes 12, you need 18 for the class.” This game frames addition with like denominators in a real-world context. Students who finish early move to Medium tier Fraction Face-Off.
- Day 5 — Mastery check. Students play one Hard round of Fraction Face-Off independently. Score is the formative checkpoint, not the grade. Class reflection: which question type is still tricky? Pair students for next-week peer support.

Week 2 — US geography and real-world data
Goal: students can name all 50 states by location and can pull one or two real data points from a state's profile. Geography and data literacy braid together: every state name is also a row in a real Census table.
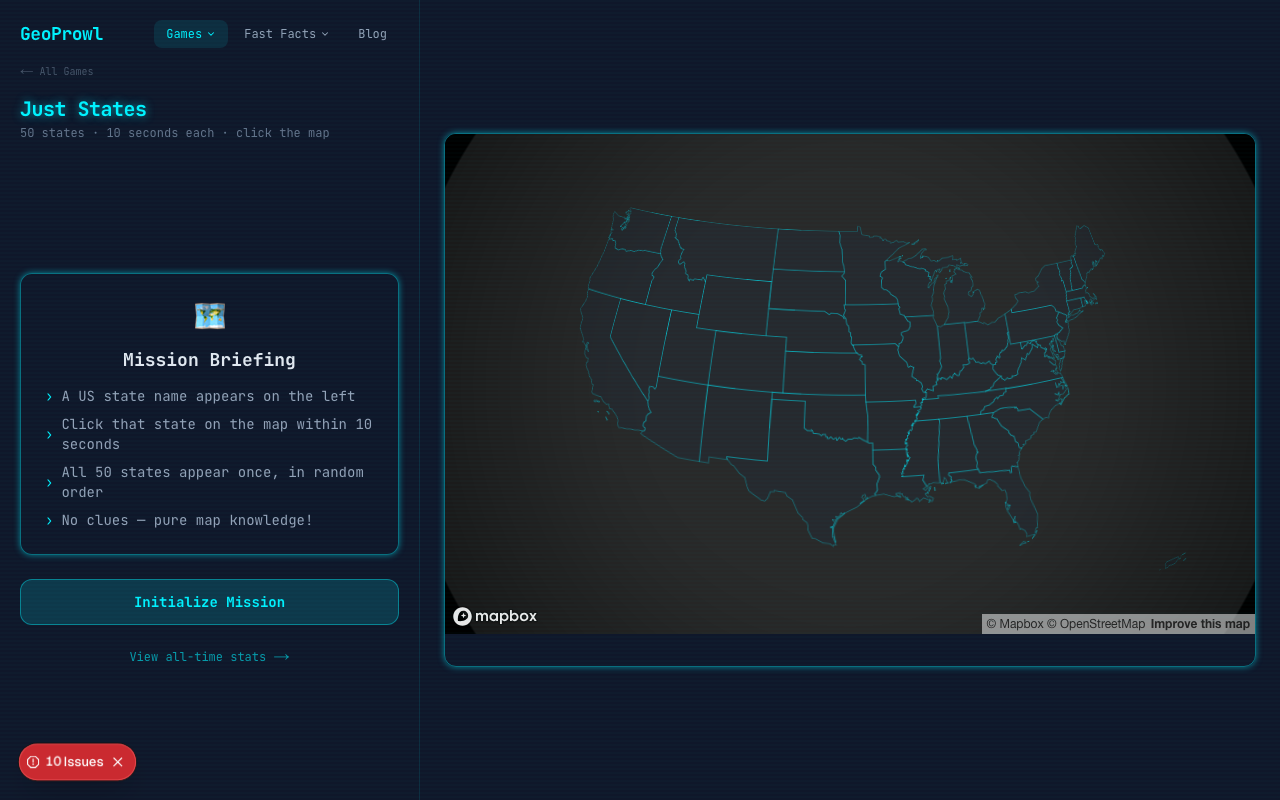
- Day 6 — State recall. Open with Just States — 50 states in 10 seconds each, click the map. Aim for 30+ correct on first attempt; track improvement across the week. Reflection: students draw the US map outline from memory and label as many states as they can.
- Day 7 — Capitals. Switch to Just Capitals. Pair this with a 10-minute discussion: why are some capitals in tiny cities (Augusta, Pierre, Frankfort) instead of the obvious big ones? Answer: political compromise. This is a real social-studies moment.
- Day 8 — State data hunt. Each student picks two states from Fast Facts: States and records four data points each: population, number of farms, highest average summer temperature, and number of National Park sites. They turn that into a comparison sentence like “Texas has 11x more farms than Hawaii.”
- Day 9 — Rank-and-compare. Class plays Rank File in small groups. Students drag five states into order by hidden metric (population, area, etc.). The reveal builds a feel for how unevenly the US is distributed — California has more people than every state west of the Mississippi combined except Texas.
- Day 10 — Photos and place. Recon Photos uses real National Park Service photos and asks students to identify which state the photo was taken in. This is a writing prompt waiting to happen: pick one photo, write a paragraph about what you'd see if you visited.
Week 3 — Solar system and scale
Goal: every student can name the 8 planets in order from the Sun and can articulate one major difference between the rocky inner planets and the gas-giant outer planets. The week sets up the Grade 5 NGSS expectations without burdening Grade 4 with extra abstraction.
- Day 11 — Order from the Sun. Open with Planet ID — animated solar system, click the named planet. After three rounds, do a quick whole-class mnemonic: “My Very Educated Mother Just Served Us Nachos.”
- Day 12 — Comparing planets. Scale Detective — “Which is bigger? Which has more gravity?” 20-round multiple choice. This is the unit's real measurement-data moment (CCSS 4.MD.A.1 — relative sizes of measurement units, applied to astronomical units).
- Day 13 — Planet profiles. Each student picks one planet from Fast Facts: Planets and records six facts: diameter, mass, moons, distance from the Sun, temperature range, and one surprising fact of their choice.
- Day 14 — Rocky vs. gas. Whole-class discussion using the planet-type aggregate stats on the Fast Facts page. What do all the rocky planets have in common? What do all the gas giants have in common? Where does Earth sit? This is the conceptual payoff of the week.
- Day 15 — Landing physics, lightly. Optional bonus for advanced students: Landing Sequence (gravity-based landing puzzle). Most fourth graders find this playable but should not be assessed on it — it's a curiosity hook, not a standard.
Week 4 — Synthesis: the State Snapshot Report
Goal: each student produces a one-page profile of one US state that integrates math (real numbers), geography (location and neighbors), and a science angle (which planet the state would be most/least habitable on, given its actual climate data from Fast Facts: States). This is a CCSS.W.4.7 short research project disguised as a fun poster.
- Day 16 — Pick and plan. Students pick a state (limit duplicates to two per state in classroom settings). Provide the rubric (see Assessments section below). Brainstorm session: what makes a state interesting?
- Day 17 — Data hunt. Students gather four required data points and at least two optional ones from their state's Fast Facts page.
- Day 18 — Map and writing. Students draw the state outline (Recon Photos can help with visual reference), label its capital and two neighboring states, and write a 100-word descriptive paragraph using their data.
- Day 19 — Planet pairing. Students answer the science angle: “If you could only live in one place outside Earth, would you pick the rocky or gas-giant version of your state's climate? Why?” One short paragraph.
- Day 20 — Present and play. Each student presents in 90 seconds. Whole class plays one celebratory round of GeoZone State Showdown to cap the unit. The reveal slides for each comparison reinforce every piece of state data they've worked with all month.
4. Cross-curricular tie-ins
The integration is not cosmetic. Every cross-curricular moment in this unit forces the student to use one skill in service of another, which is what makes the knowledge stick:
- Math + geography: comparing two states' populations exercises 4.OA.A.3 multi-step problem solving while teaching real-world geography (Florida has 5x California's coastline but fewer mountains — why?).
- Math + science: Scale Detective requires multi-digit comparison every round (Jupiter's mass is roughly 318 Earths; Neptune is 17). 4.NBT place value and 4.MD.A.1 relative measurement live inside every answer choice.
- Writing + everything: the Day 10 Recon Photos writing prompt and the Day 20 State Snapshot Report use data students have actually engaged with — this is when descriptive writing stops being abstract.
- Social studies + math: the Day 7 capitals discussion (why are capitals often in small cities?) opens the door to early civics — political compromise, geography as power. This anchors the unit in C3 framework standards, not just CCSS.
5. Assessments
The unit relies on three formative checkpoints and two summative assessments. Game scores are evidence but not the only evidence — the writing and the synthesis project are what most state standards actually expect at this grade level.
Formative (during the unit)
- Day 5 Hard Fraction Face-Off score. Target: 10/15 correct. Below 7 means the student needs week-2 review on common denominators before the data-hunt activities.
- Day 10 second Just States attempt. Target: at least 10 more states correct than the Day 6 diagnostic. This is the growth metric.
- Day 12 Scale Detective. Target: 12/20 correct. Below 8 means the relative-size concept isn't there yet — slow down week 3.
Summative (end of unit)
- State Snapshot Report. Rubric points: accurate state outline and capital (3), correct data points (4), 100-word descriptive paragraph using two or more data points (5), planet-pairing reasoning (3). Total /15.
- Final Just States timed run. Target: 45/50 correct in under 8 minutes. This is the geography fluency standard.
6. Differentiation
Three groups need explicit accommodations: students below grade level in math, English-language learners, and students who are ahead. The plan handles each:
- Below grade level in math: keep them in Fraction Face-Off Easy tier through Day 4 instead of moving to Medium. Skip Ratio Kitchen Day 4 in favor of a second Easy round. For the State Snapshot Report, reduce required data points from four to two.
- English-language learners: Just States and Just Capitals are language-light by design — the visual map is the cognitive load. Recon Photos pairs well with a vocabulary list of geographic terms (canyon, mesa, plateau, forest). For the writing portion, allow a sentence frame: “The state of ___ has ___ people and ___ farms.”
- Advanced learners: after week 1, run Fraction Face-Off Hard tier as a daily warm-up. For week 3, add the optional Landing Sequence game and have them compare landing difficulty on Mercury vs. the Moon (it's harder on the Moon — lower gravity, so thrusters overshoot easier). For the synthesis project, require five data points and a comparison-paragraph between two states.
- Twice-exceptional (gifted with a learning difference): keep the cognitive ceiling high (Hard tier games, advanced project requirements) but allow oral presentation instead of written for the summative project.
7. Course materials
The unit is built around free interactive games, so equipment needs are minimal. A working device with a browser is the only required piece. The supplementary materials below deepen the experience but aren't mandatory:
- A laminated US map. Worth its weight. Students label and re-label it across the unit. Wall-sized works for classrooms; desk-sized works for homeschool.
- Fraction manipulatives (foam tiles or magnetic bars). For Day 1 of week 1, when students need to physically see what “equivalent” means. After Day 2, most students stop needing them.
- A simple set of measuring cups. Ratio Kitchen on Day 4 is much more powerful when students can physically scale a real recipe in parallel (one of our pilot teachers had students make actual cookies and the unit retention jumped noticeably).
- An inflatable globe or planet poster set. Week 3 benefits enormously from physical reference. A cheap inflatable Earth and a planet poster set together cost roughly what a single textbook chapter does.
- One picture book about a National Park. For week 2 day 10 Recon Photos writing prompt, having a high-quality NPS photo book on the desk gives reluctant writers something concrete to anchor their description.
8. For homeschool parents
The unit was tested in both classroom and homeschool settings. The homeschool version compresses naturally to about 15 sessions across 3 weeks because the “classroom management” overhead disappears. A few specific adaptations:
- Skip the diagnostic. If you already know where your child sits in fractions, Day 1 becomes a normal teaching day. Start at the tier that matches their current fluency.
- Combine Days 6 and 7. Just States and Just Capitals can be done back-to-back in a single sitting. The transition is natural and the second game reinforces the first.
- Make the project bigger. With a single learner, the State Snapshot Report can grow to a three- to five-page report covering two states in comparison. That bumps it into a small but real W.4.7 short research project.
- Use the journey as content. If you're a road-schooling family, this unit pairs almost perfectly with travel: each Recon Photos session can be followed by an actual visit to the park in question if it's on the route.
- Multi-grade families: keep younger siblings (Grade 2–3) on the easier games (Africa map, Planet ID, Pollen Run) during the same sessions. They'll absorb more than you expect.
9. Frequently asked questions
How long does this unit take to teach?
The plan is built for four weeks at roughly 30–45 minutes per day, five days per week — about 12 hours of total instructional time. Homeschool families typically compress this into three weeks by combining the shorter activities. Classroom teachers running shorter math blocks (20 minutes) can stretch it to six weeks without losing coherence.
Which Common Core and NGSS standards does it cover?
Primary coverage: CCSS.MATH.4.NF.A and 4.NF.B (fractions), 4.MD.A and 4.MD.B (measurement and data), 4.OA.A (operations and algebraic thinking), CCSS.ELA-LITERACY.W.4.7 (short research projects), and NGSS 5-ESS1-1 (Earth's place in the universe — a Grade 5 standard introduced as a bridge). Social studies coverage maps to the C3 framework standard D2.Geo.2.3-5 (use geographic representations to explain spatial patterns).
Does this work without internet access?
Most of the games are best played in a browser, but every game has a printable counterpart suggested in the unit structure. The unit can also be run on a single classroom projector with one shared device, rotating students through interactive sections — that's how about 30% of GeoProwl's pilot classrooms run it.
What if my students are below grade level in math?
The Differentiation section below lists per-game adjustments. Fraction Face-Off has explicit Easy/Medium/Hard tiers that students can self-pace through; struggling readers can pair-play with a stronger reader; and the Just States geography game lets students who are not fluent with state names build confidence with map-reading instead. Nothing in this plan requires fluent reading above a Grade 3 level.
How do I assess student learning if scores are not enough?
The Assessments section below lists three formative and two summative checkpoints. Game scores are evidence but not the only evidence — the plan culminates in a 'State Snapshot Report' (one-page student-built profile of a US state using site data), which serves as the summative artifact. A rubric outline is included.
Can I use this with a multi-grade homeschool group?
Yes. Grade 2–3 students can join the Solar System and Geography activities at a simpler level (Planet ID instead of Scale Detective, Africa instead of Just States). Grade 5–6 students should pair this unit with the Grade 5 or Grade 6 plan and use this unit's content as warm-up review.
Start the unit
Day 1 begins with one Easy round.
Open Fraction Face-Off and start the diagnostic.
Open Fraction Face-Off →